SB1 Sensor Bridge
Part Number: 10083
Product Overview
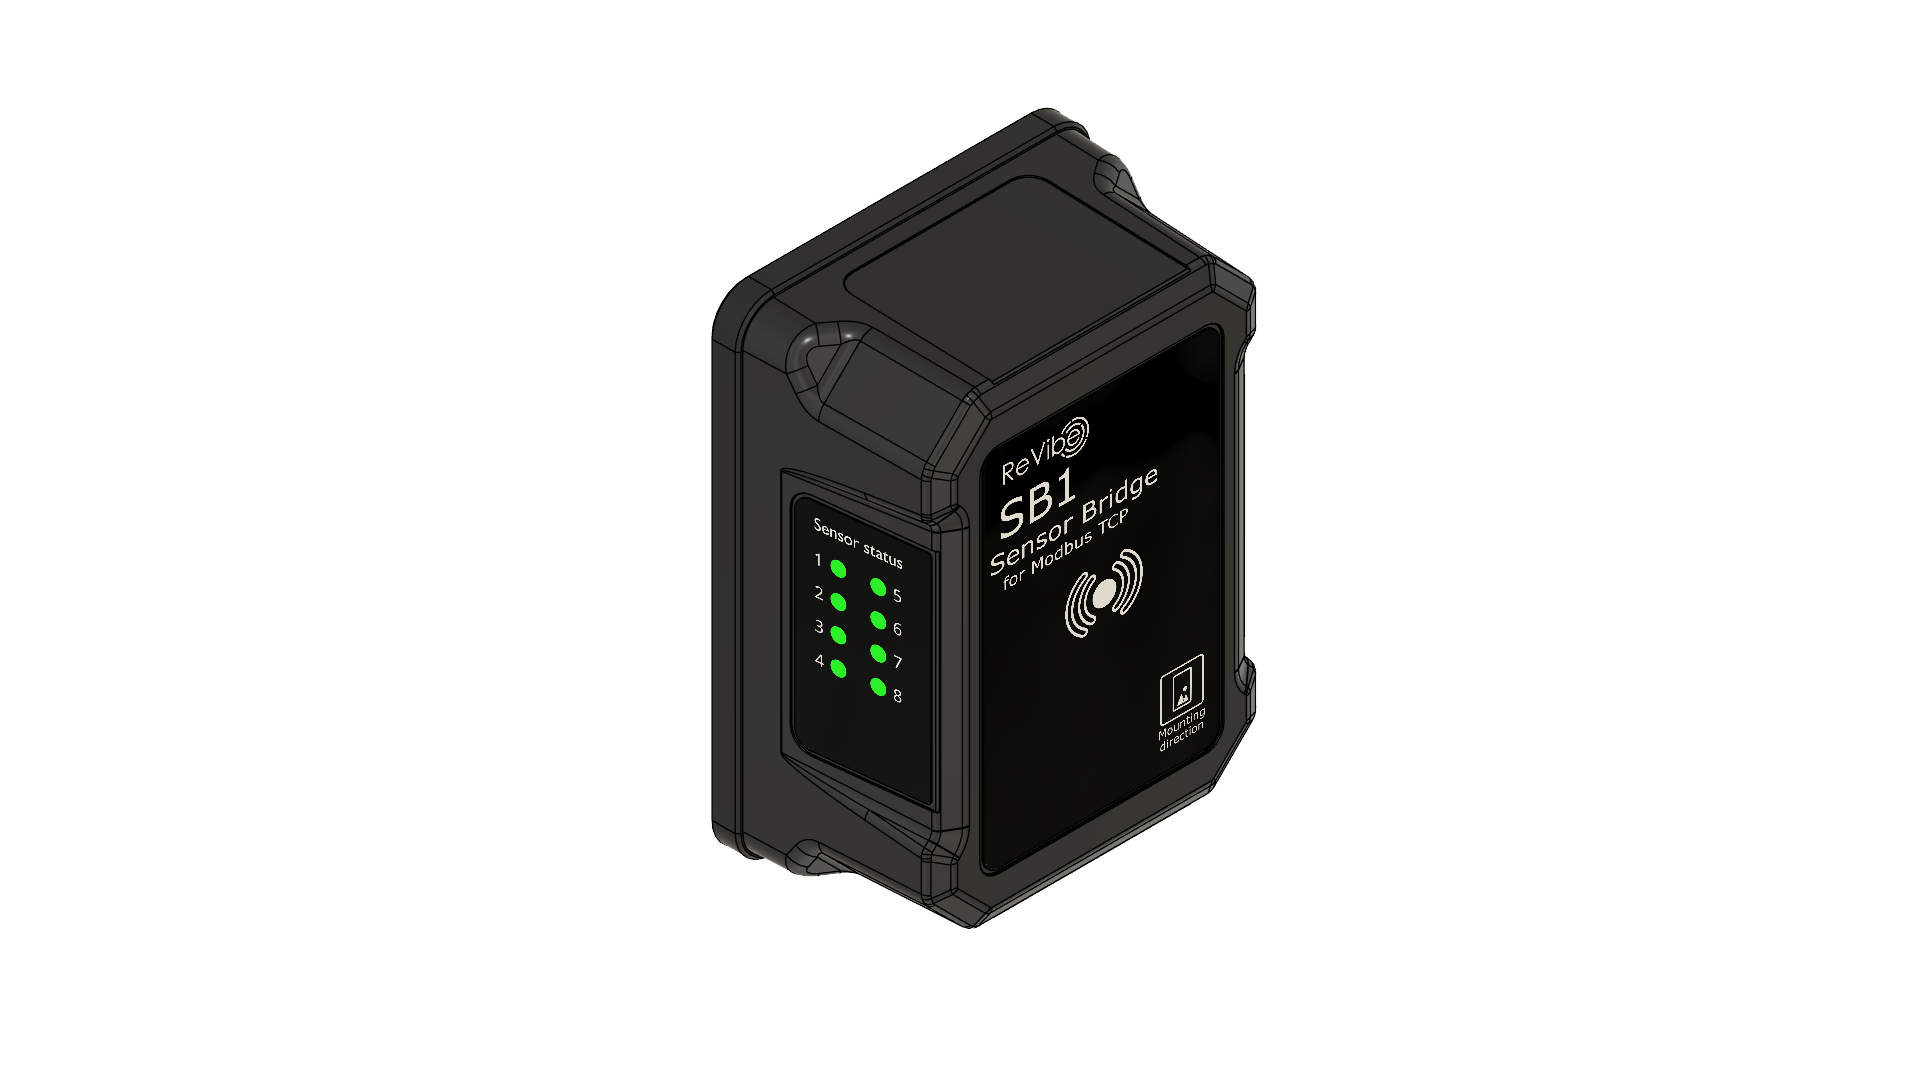
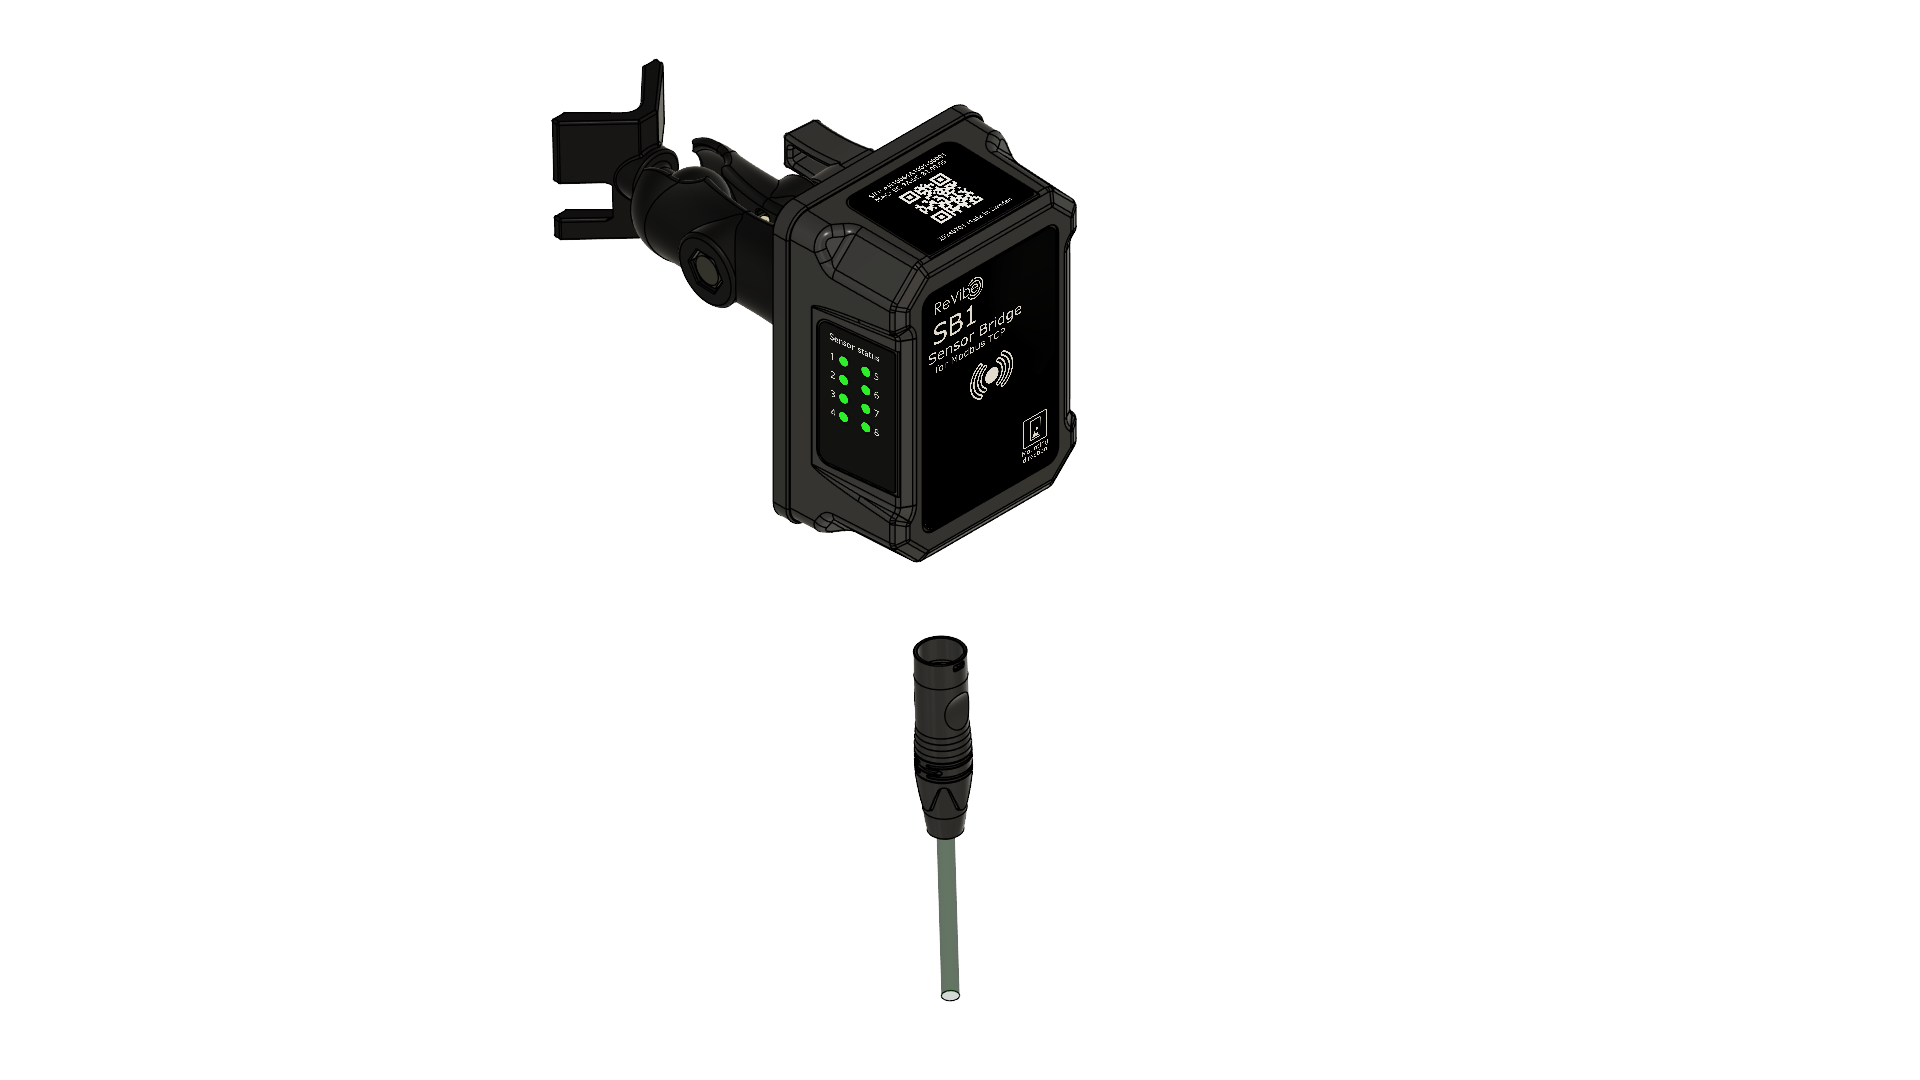
The ReVibe SB1 is a Power-over-Ethernet (PoE) sensor bridge designed to use Modbus TCP to transmit measurement data which it receives wirelessly from connected sensors. SB1 is designed to work with the ANURA VS family of sensors, utilizing the 2.4 GHz spectrum for communication. SB1 enables the Anura system to establish and manage connections with up to eight sensors per unit.
Package Contents
Part Number: 10083
Part Number: 40008
Part Number: 40007
Part Number: 40006
Hardware Overview
Ethernet Port
The etherCON® CAT6A port provides both network connectivity and PoE power. Standard RJ45 Ethernet cables are compatible, but for IP65 ingress protection and full warranty coverage, use ReVibe official cables.
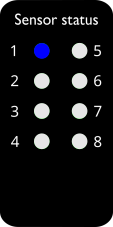
Sensor Status LEDs
LED Color |
Status |
|---|---|
Blue |
Connection established, protocol initialization in progress |
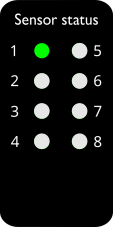
Green |
Connected and fully operational |
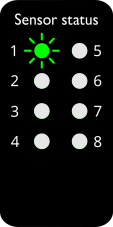
Green (blinking) |
Active data transmission to/from sensor |
Orange (all 8) |
Device reset in progress |
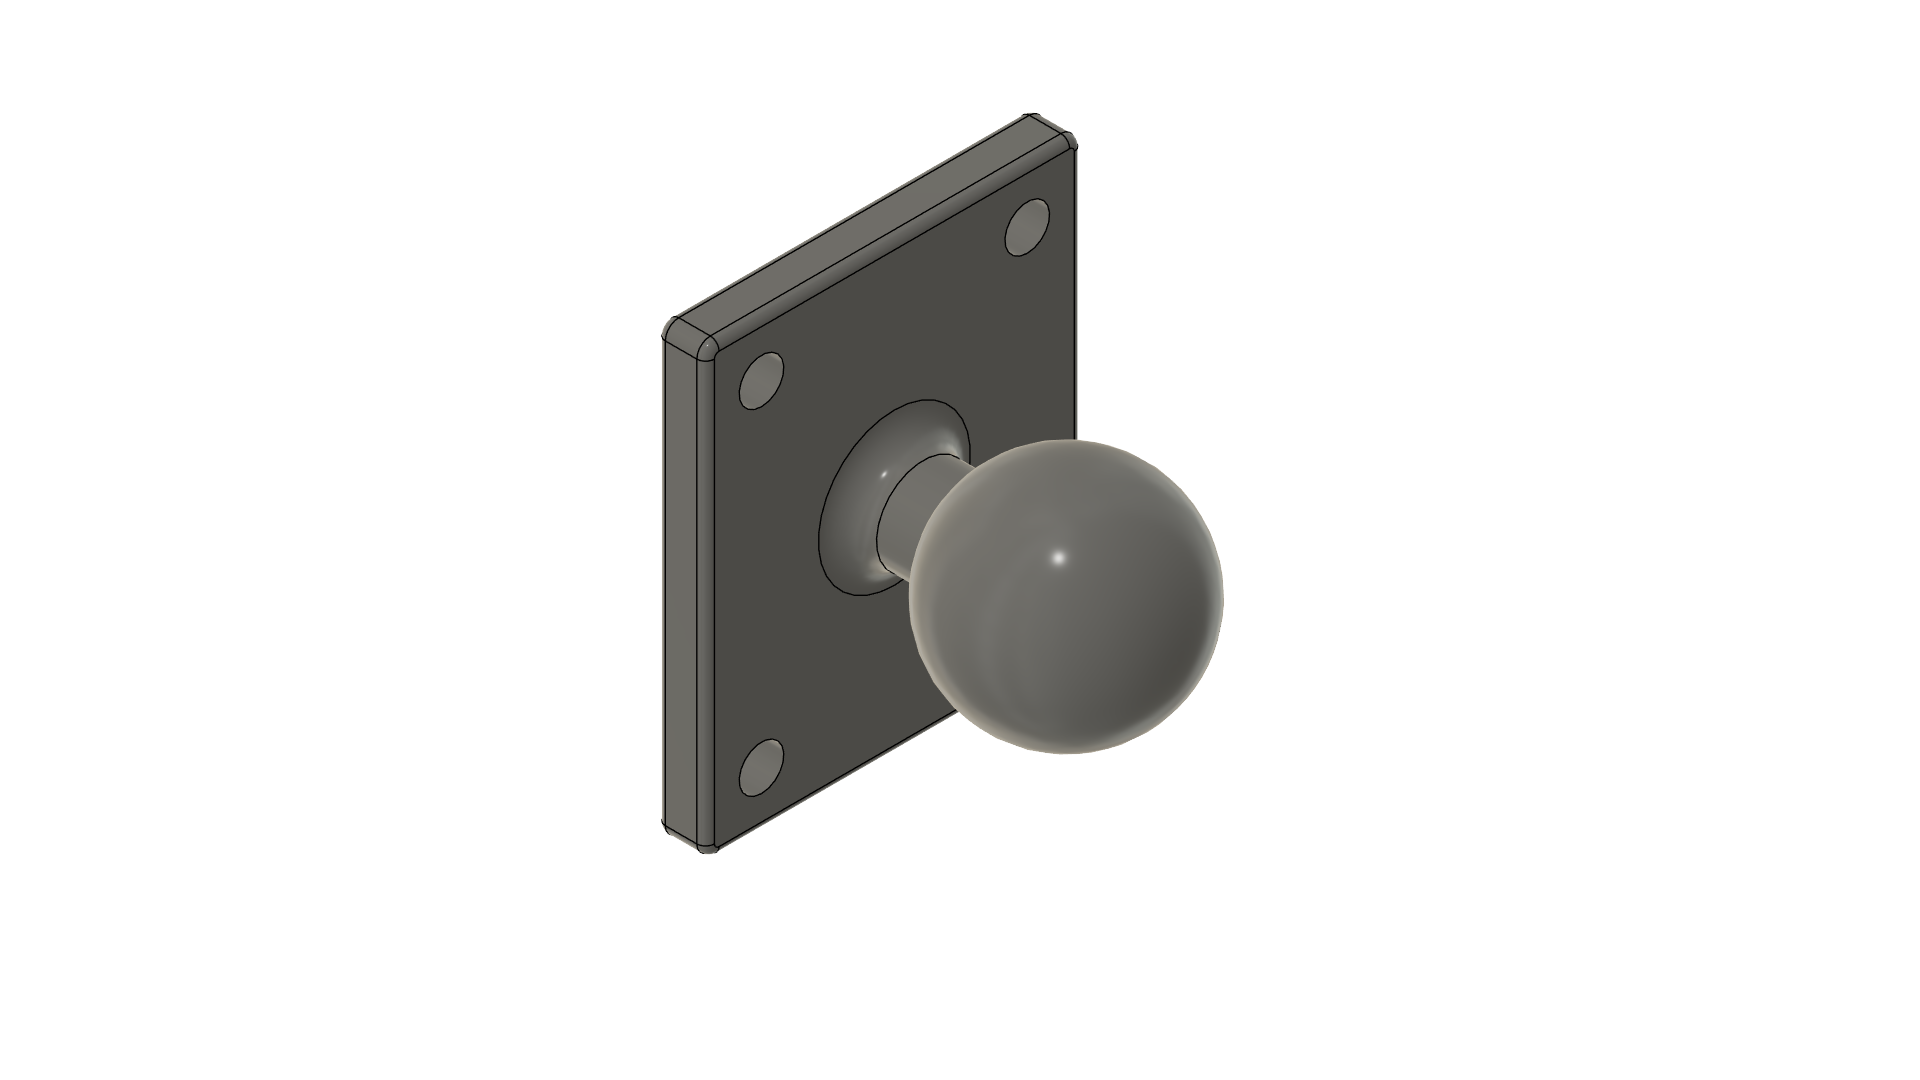
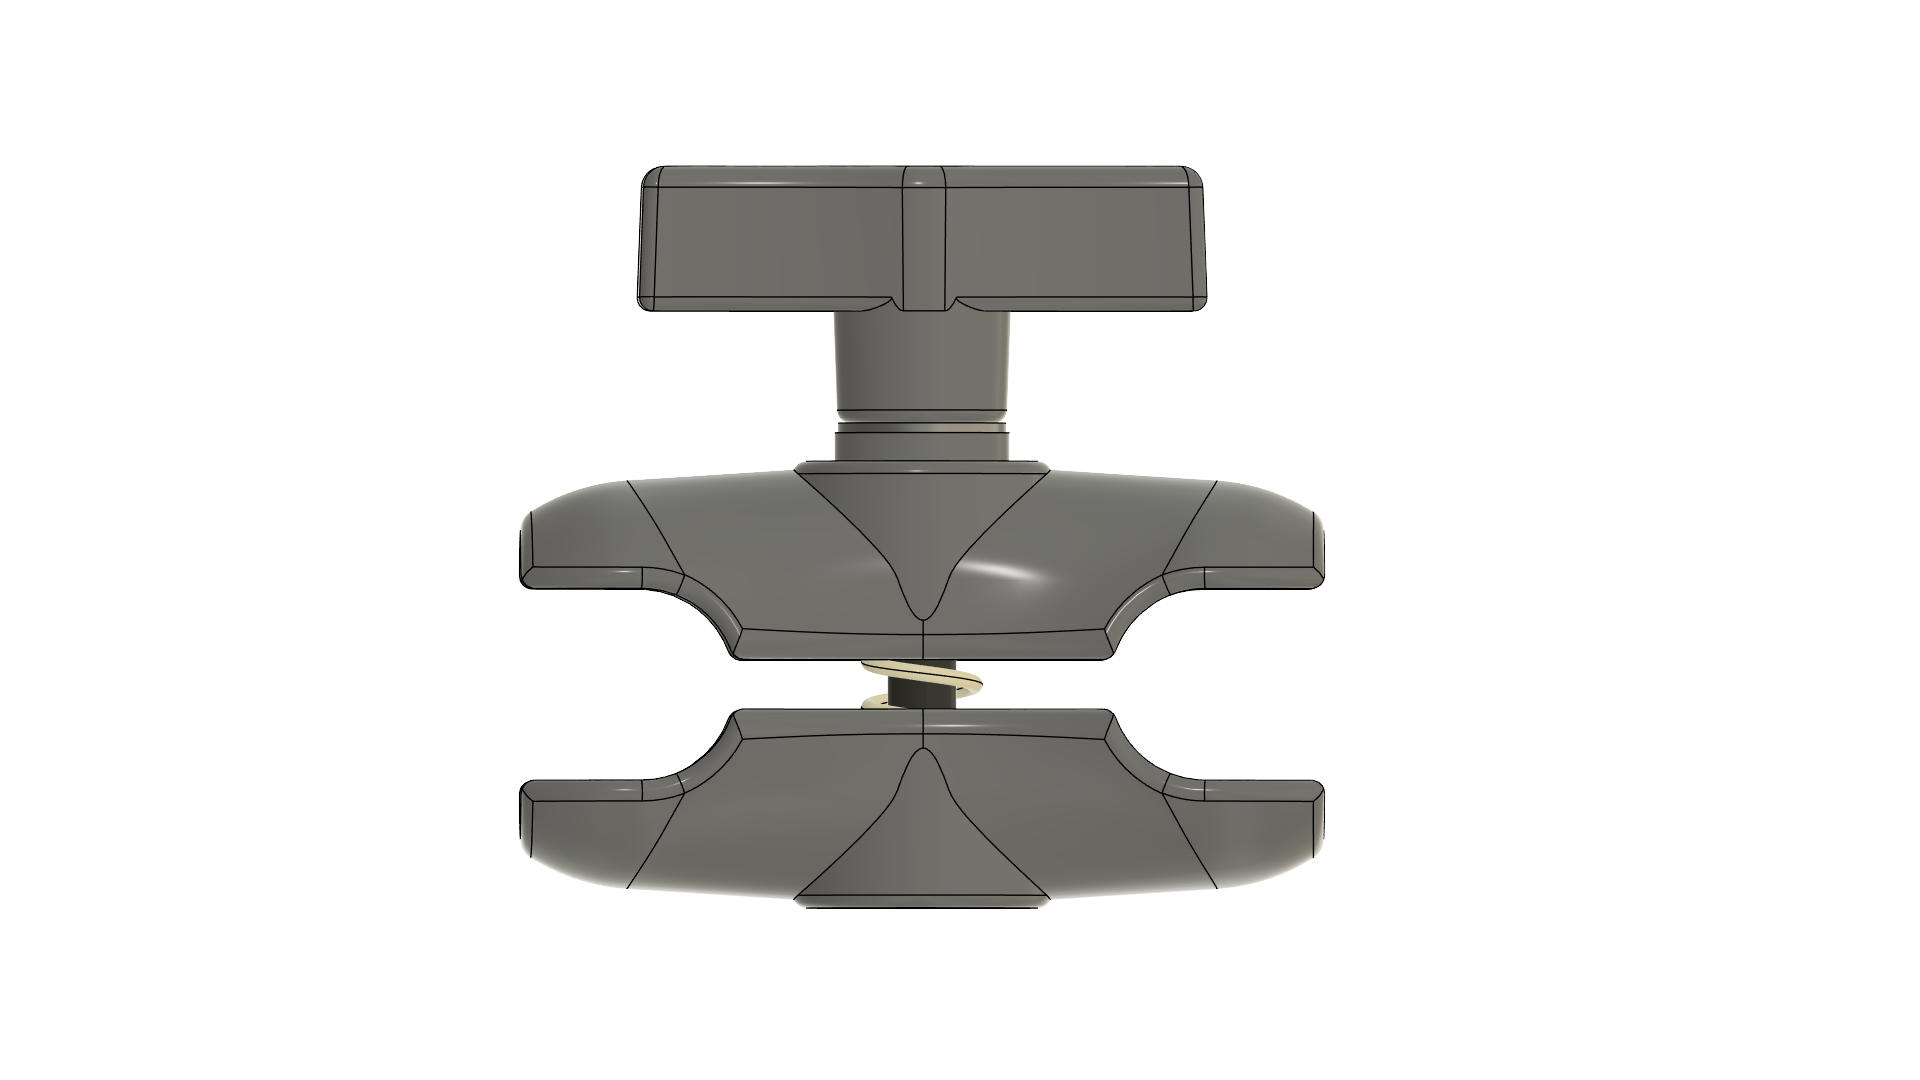
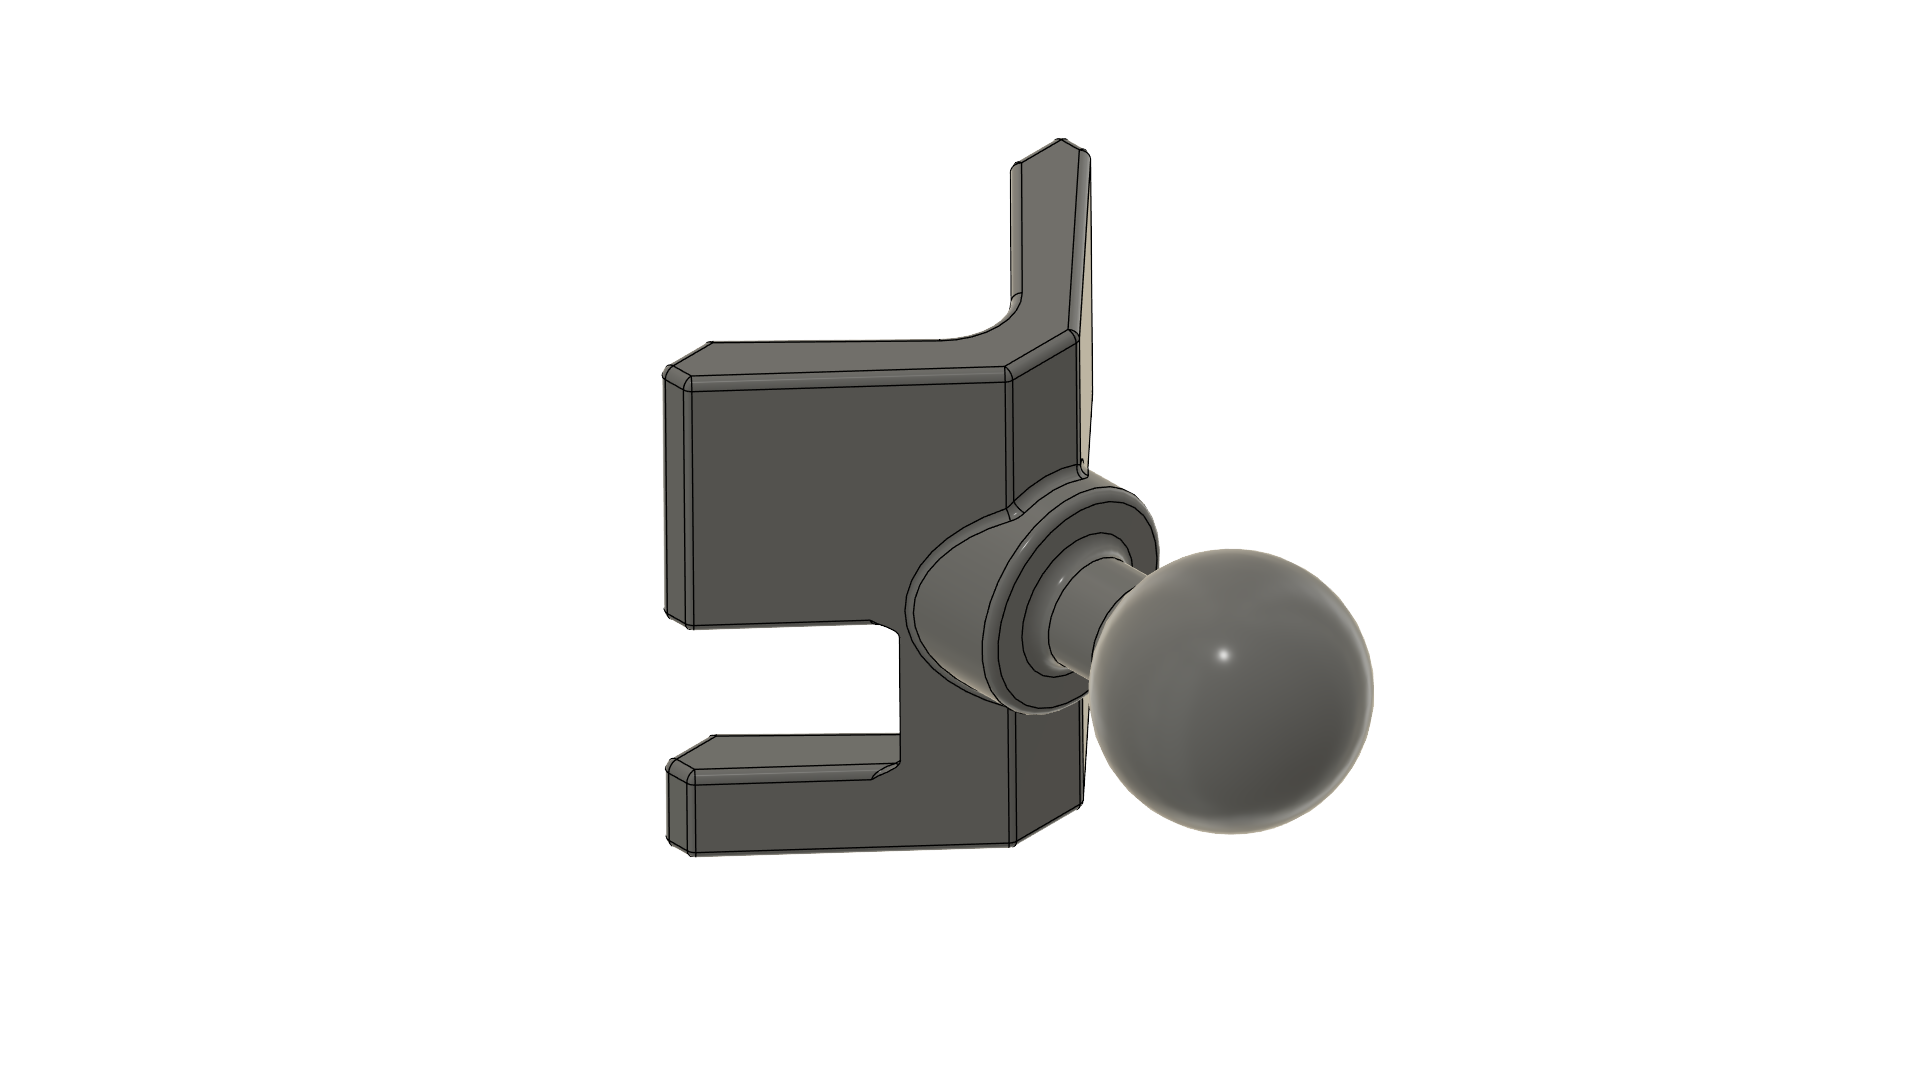
Ball Mount
The SB1 ships with a 1-inch mounting ball pre-assembled to the AMPS 4-hole mounting pattern on the rear panel. The ball mount enables use with a wide variety of mounting arms and brackets.
Network Requirements
The SB1 operates in standard Ethernet networks. Key requirements:
Power: IEEE 802.3af compliant PoE switch or injector
Installation Requirements
Please ensure that these requirements are fulfilled before starting the installation process:
✅ You have access to edit the automation controller’s configuration.
✅ The automation controller has a Modbus TCP client (alternatively you can use a Modbus TCP gateway).
✅ A computer with which to configure the sensor bridge and the automation controller.
✅ Tools for physically mounting components in desired locations.
✅ A few regular Ethernet cables.
Sensor preparations
If the sensors haven’t already been installed, do so according to the instructions that came with the sensors.
Write down the BLE address for each sensor. You find the BLE address written on the sensor’s case under ID: in the format of AA:BB:CC:DD:EE:FF.
It may be useful to keep track of which sensor BLE address corresponds to which physical sensor (e.g. by having a name or number for each), in case you later wish to use the values from different sensors in different ways.
Physical installation
Mount the sensor bridge in its desired operation location. Connect the sensor bridge to a PoE port on the Ethernet switch using the provided RJ45 to Neutrik etherCON cable. Eight orange LEDs on the transceiver indicate power and readiness on startup.
Connect the automation controller’s Modbus TCP interface to the Ethernet switch using an Ethernet cable.
Setting your computer’s IP address
Connect your computer to the Ethernet switch using an Ethernet cable. For Windows 11, open the Settings app and navigate to Network & internet and click on Ethernet. (For other operating systems guides exist online, search for “Setting static IP address in my operating system”.)

On this page, there is a row for the device’s IP assignment, click Edit.
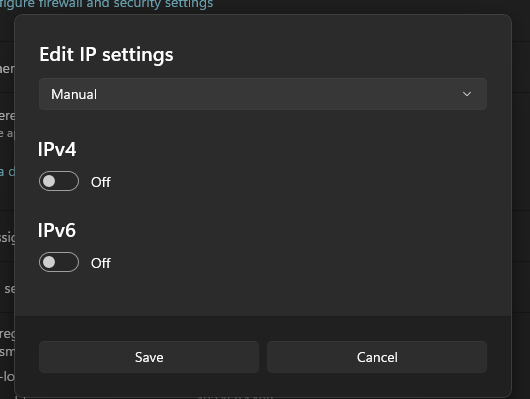
Select Manual in the dropdown. Then turn on the IPv4 switch.
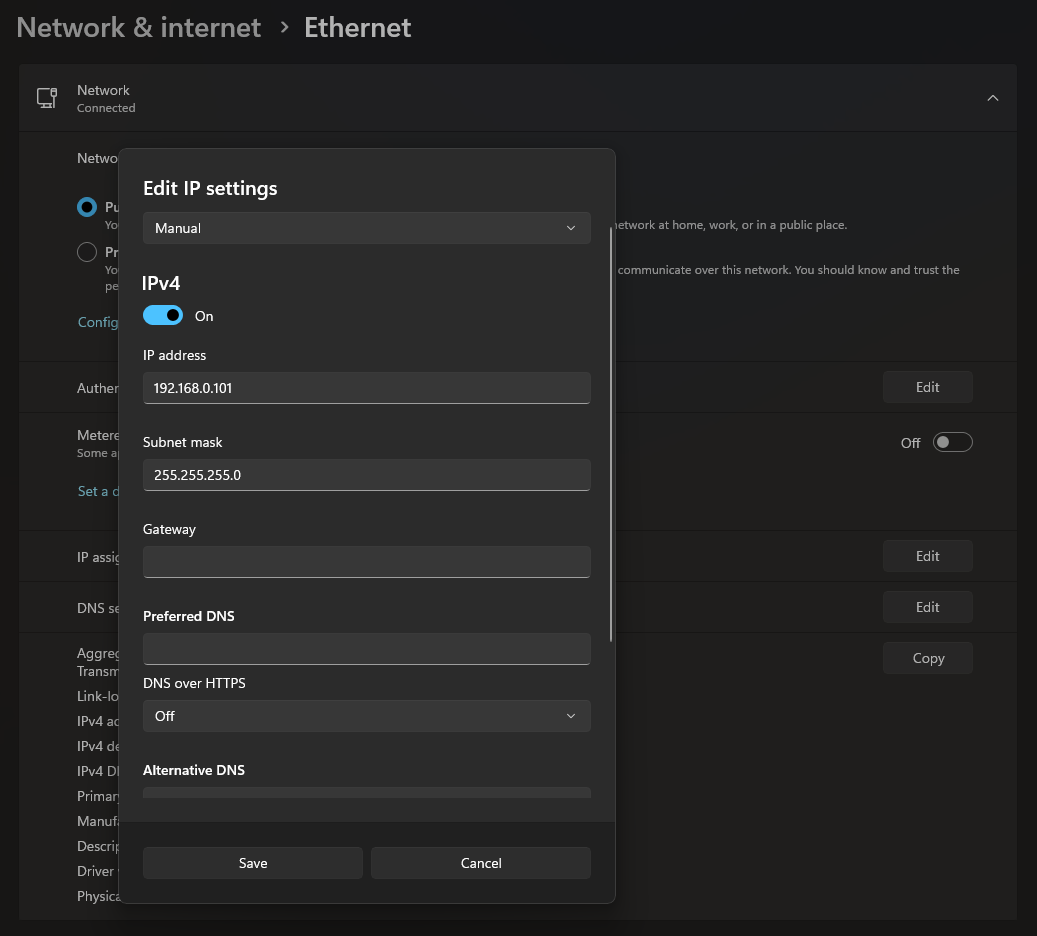
Fill in the fields you are presented with as follows:
● Set the IP address to 192.168.0.101, this will ensure that your computer is on the same network as the sensor bridge
● Set the subnet mask to 255.255.255.0
● The remaining fields can be left blank
Click Save to apply the settings.
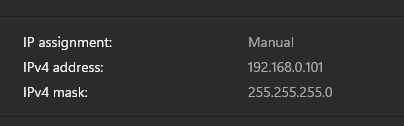
The page should now tell you that your IP assignment is set to be manual, along with the configured IP address and subnet mask.
Setting the sensor bridge’s IP address
Check that the sensor bridge is reachable on the network by pinging it at its default IP address, which is 192.168.0.100.
Table 1: SB1 Default network configuration
Default IP address |
192.168.0.100 |
Default netmask |
255.255.255.0 |
Default gateway |
192.168.0.1 |
Decide what IP address the sensor bridge should have in your particular installation case.
Next up there are two methods for setting the sensor bridge’s new IP address: Through a web browser, or over a Modbus connection.
Method 1: Set the IP address through a web browser
Open a web browser on your computer. Type 192.168.0.100 (the current IP address of the SB1) into the browser’s address field and hit enter. If everything is working correctly, you should be greeted with the sensor bridge’s setup page. The section of the page labelled Network Configuration is what we will use here. Under Update Settings, write the new IP address into the field labelled IP Address. You also need to fill in values for the netmask and the gateway address. If you want them changed, enter their new values into the relevant fields, otherwise enter the same value as is presented under Current Settings. Hit the Apply button in order to apply and save the entered values on the sensor bridge.
Method 2: Set the IP address over Modbus
Download and install a Modbus client on your computer. E.g. the Modbus Master Simulator at
Radzio! Modbus Master Simulator.
Set the server details as follows:
● IP address: 192.168.0.100
● Port: 502
● Unit/device-id: 1
Table 2: Map of registers used for device info including the network configuration
Address |
Description |
Type |
Size (Registers) |
|---|---|---|---|
40001-40016 |
Boardname (ASCII) |
STRING (32 bytes) |
16 |
40017-40018 |
Hardware revision |
UINT32 |
2 |
40019-40034 |
Device ID (ASCII) |
STRING (32 bytes) |
16 |
40035-40050 |
Application version (ASCII) |
STRING (32 bytes) |
16 |
40051-40066 |
Build version (ASCII) |
STRING (32 bytes) |
16 |
40067-40082 |
Serial number (ASCII) |
STRING (32 bytes) |
16 |
40083-40098 |
Hostname (ASCII) |
STRING (32 bytes) |
16 |
40099-40101 |
MAC address (48-bit) |
UINT 48 |
3 |
40102-40103 |
Static IP address (IPv4) |
UINT 32 |
2 |
40106-40107 |
Gateway (IPv4) |
UINT 32 |
2 |
40108-40109 |
Netmask (IPv4) |
UINT 32 |
2 |
Convert the new IP address for the sensor bridge to two UINT16 numbers (so that they can be written to the relevant registers) as follows: If the IP address is a.b.c.d, calculate the high UINT16 as (a∙256+b), and the low UINT16 as (c∙256+d).
To change the sensor bridge’s Static IP address, write the high and low resulting numbers to the holding registers at address 40102 and 40103 respectively, as can be seen in table 2. (The Modbus function code for Write Multiple Holding Registers is 16.)
To also change the gateway address or netmask: First convert it to UINT16 numbers as described above. Then write the results to the registers for that particular setting, which can be found in table 2.
Table 3: Map of registers used for configuration activation & device control
Address |
Description |
Type |
Size (Registers) |
|---|---|---|---|
40600 |
Apply Configuration (1 = Apply, 2 = Save and Apply) |
UINT16 |
1 |
40601 |
Reboot Command (1 = Reboot) |
UINT16 |
1 |
40602 |
Sensor Reading Reload (1 = ‘Automatic, 2 = Manual) |
UINT16 |
1 |
To apply the new network configuration, write a 1 to the holding register at address 40600 (See table 3). (The Modbus function code for Write Single Holding Register is 6.)
Finishing up
Regardless of which method you used for setting the sensor bridge’s new IP address some simple tests can be performed.
Ping the sensor bridge’s default IP address of 192.168.0.100. It should not respond as it now has a different IP address configured.
To once again put your computer on the same network as the sensor bridge, edit your computer’s static IP address as in installation step 4 of this document. This time set your IP address and subnet mask based on the network settings of your particular installation case.
Now your computer and the sensor bridge should be on the same network. To test, ping the sensor bridge’s new IP address. This time it should respond.
If you set the sensor bridge’s IP address over Modbus, there is one last step: To save the new network configuration in non-volatile RAM, write a 2 to the holding register at address 40600.
Registering the sensors with the sensor bridge
Access the automation controller’s configuration.
A complete description of the Modbus protocol is outside the scope of this manual. Check your vendor’s instructions for how to access Modbus communications from your particular automation controller.
Set up a Modbus client in the automation controller’s configuration. Set the server details as follows:
● IP address: What you previously configured the sensor bridge with
● Port: 502
● Unit/device-id: 1
For each sensor that the sensor bridge should connect to, decide which of the sensor bridge’s slots (from 1-8) that sensor should occupy.
Table 4: Map of registers used for the sensors’ BLE addresses
Address |
Description |
Type |
Size (Registers) |
|---|---|---|---|
40500-40502 |
BLE Address - Sensor 1 |
UINT48 |
3 |
40503 |
Address Type - Sensor 1 |
UINT16 |
1 |
40504-40506 |
BLE Address - Sensor 2 |
UINT48 |
3 |
40507 |
Address Type - Sensor 2 |
UINT16 |
1 |
40508-40510 |
BLE Address - Sensor 3 |
UINT48 |
3 |
40511 |
Address Type - Sensor 3 |
UINT16 |
1 |
40512-40514 |
BLE Address - Sensor 4 |
UINT48 |
3 |
40515 |
Address Type - Sensor 4 |
UINT16 |
1 |
40516-40518 |
BLE Address - Sensor 5 |
UINT48 |
3 |
40519 |
Address Type - Sensor 5 |
UINT16 |
1 |
40520-40522 |
BLE Address - Sensor 6 |
UINT48 |
3 |
40523 |
Address Type - Sensor 6 |
UINT16 |
1 |
40524-40526 |
BLE Address - Sensor 7 |
UINT48 |
3 |
40527 |
Address Type - Sensor 7 |
UINT16 |
1 |
40528-40530 |
BLE Address - Sensor 8 |
UINT48 |
3 |
40531 |
Address Type - Sensor 8 |
UINT16 |
1 |
For each sensor, its BLE address will be registered to a particular slot. In order to do this we first need to convert the BLE address into three UINT16 numbers, so they can be written to the relevant registers. Take care to note that the BLE address is written in hexadecimal. If the BLE address is a:b:c:d:e:f, calculate the first UINT16 as (a∙256+b), the second UINT16 as (c∙256+d), and the third UINT16 as (e∙256+f).
With the BLE address converted, write the resulting numbers to the three holding registers for the relevant slot which can be found in table 4 as BLE Address – Sensor n. (E.g. to register a sensor to slot 3, write the first, second, and third resulting numbers to the registers at address 40508, 40509 and 40510 respectively.)
Furthermore, we need to specify whether the address is public or private. Write a 0 (public) or a 1 (private) to the holding register specified in table 4 as Address Type - Sensor n for the relevant slot. (Normally the address will be public.)
Repeat this process for each of the sensors.
To both apply the sensor registration and save it in non-volatile RAM so it persists across reboots (recommended), write a 2 to the holding register at address 40600 (See table 3). To only apply the sensor registration (without saving it in non-volatile RAM), write a 1 to address 40600.
Even though it’s possible to save the sensor registration in the sensor bridge itself, it is still recommended to keep up-to-date sensor registration code in the automation controller. This is to ensure a consistent setup even if the sensor bridge needs replacing.
On the side of the sensor bridge there are eight LEDs indicating the status of each sensor slot. After having applied the sensor registration, observing these LEDs may be helpful:
a. A blue LED indicates that a connection to a sensor is being initiated
b. A solid green LED indicates that a connection to a sensor has been established
c. A blinking green LED indicates that data is being transmitted from the connected sensor
a
b
c
When the code runs on the automation controller, the instructions to register the sensors to the specified slots will be written to the sensor bridge which will then initiate communication with the specified sensors.
The sensors’ data will then be available from the sensor bridge at specific input registers; the addresses for these registers correspond to the slots to which the sensors were registered.
Configuring the sensors’ standby behavior
Through the SB1, some aspects of the connected sensors’ behavior can be configured. These all pertain to the sensors’ behavior relating to standby mode. When a sensor is in standby mode it will not send values to the sensor bridge, it will only measure the bare minimum of what is needed to know when to leave standby mode. This is done to avoid needlessly wasting battery life when the readings are too low to be considered noteworthy.
Table 5: Map of registers used for sensor configuration. This block repeats for the eight sensors at addresses 41100, 41200, …, 41800.
Address |
Description |
Type |
Size (Registers) |
|---|---|---|---|
41100-41101 |
Min RMS acceleration to detect motion (g) |
FLOAT32 |
2 |
41102-41103 |
Acceleration delta to exit standby (g) |
FLOAT32 |
2 |
41104 |
Time of no motion before standby (ms) |
UINT16 |
1 |
41105 |
Sample rate during wake-on-motion standby (Hz) |
UINT16 |
1 |
Each sensor has four parameters that can be configured (as can be seen in table 5):
● The Min RMS acceleration to detect motion (g)
determines the minimum threshold of RMS acceleration that counts as motion.
● The Acceleration delta to exit standby (g)
determines the minimum delta in acceleration between two successive measurements
in standby mode which is needed to cause the sensor to leave standby mode.
● The Time of no motion before standby (ms)
says for how long the device continually must be below the acceleration threshold
before it enters standby mode.
● The Sample rate during wake-on-motion standby (Hz)
determines at what rate measurements are taken when in standby mode,
to see if the sensor should leave standby mode.
Table 6: Default sensor configuration
Min RMS acceleration to detect motion (g) |
0.050 |
Acceleration delta to exit standby (g) |
0.050 |
Time of no motion before standby (ms) |
1000 |
Sample rate during wake-on-motion standby (Hz) |
50 |
The sensor configurations are stored in holding registers according to table 5, especially note that the address block in this table repeats for the eight sensors (sensor slot 1, sensor slot 2, …, sensor slot 8) at addresses 41100, 41200, …, 41800 respectively. By default the configuration for every connected sensor will be as seen in table 6.
Access the automation controller’s configuration.
Let’s take the example that we want to set the Acceleration delta to exit standby to 0.203125 g for the sensor we registered to slot 3. First, we need to convert the desired value of 0.203125 to the appropriate format, in this case a FLOAT32. This FLOAT32 value can then be split into its high 16bits and its low 16 bits, which then can be written to the relevant registers (41302 and 41303 respectively, as seen in table 5).
To accomplish this, libraries exist for some programming languages. For example in python the whole conversion can be accomplished with struct.unpack(“!HH”, struct.pack(“!f”, 0.203125)).
Check to see if your specific automation controller’s environment supports operations like this.
If you instead one-off need to manually convert a decimal value to this format, the specification of a FLOAT32 is documented on https://www.sciencedirect.com/topics/computer-science/single-precision-format and the procedure for the conversion is described at https://en.wikipedia.org/wiki/Single-precision_floating-point_format#Converting_decimal_to_binar y32. An example conversion will also be presented here:
To convert the decimal number 0.203125 to binary we find its binary fraction digits/bits one-by-one:
  0.203125 · 2 = 0. 40625 = 0 + 0. 40625 ⇒ 𝑏−1 = 0 (𝐷𝑜𝑢𝑏𝑙𝑖𝑛𝑔, 𝑡ℎ𝑒 𝑖𝑛𝑡𝑒𝑔𝑒𝑟 𝑝𝑎𝑟𝑡 𝑖𝑠 𝑡ℎ𝑒 𝑓𝑖𝑟𝑠𝑡 𝑏𝑖𝑡)
  0.40625 · 2 = 0. 8125 = 0 + 0. 8125 ⇒ 𝑏−2 = 0 (𝑅𝑒𝑝𝑒𝑎𝑡𝑖𝑛𝑔 𝑡ℎ𝑒 𝑝𝑟𝑜𝑐𝑒𝑠𝑠 𝑤𝑖𝑡ℎ 𝑡ℎ𝑒 𝑓𝑟𝑎𝑐𝑡𝑖𝑜𝑛 𝑝𝑎𝑟𝑡)
  0.8125 · 2 = 1. 625 = 1 + 0. 625 ⇒ 𝑏−3 = 1
  0.625 · 2 = 1. 25 = 1 + 0. 25 ⇒ 𝑏−4 = 1
  0.25 · 2 = 0. 5 = 0 + 0. 5 ⇒ 𝑏−5 = 0
  0.5 · 2 = 1. 0 = 1 + 0. 0 ⇒ 𝑏−6 = 1 (𝐵𝑒𝑐𝑎𝑢𝑠𝑒 𝑡ℎ𝑒 𝑓𝑟𝑎𝑐𝑡𝑖𝑜𝑛 𝑝𝑎𝑟𝑡 𝑖𝑠 𝑧𝑒𝑟𝑜 𝑎𝑡 𝑡ℎ𝑖𝑠 𝑝𝑜𝑖𝑛𝑡 𝑤𝑒 𝑠𝑡𝑜𝑝)
By reading the found binary digits, we see that the binary representation of 0.203125 is 0.001101. 𝑒
This value must next be normalized to the format (1. 𝑏−1𝑏−2𝑏−3… 𝑏−23) · 2 .
This means shifting 2 the value so there is a single 1 to the left of the binary point and introducing an exponent so it’s −3 still the same value.
In our case: 0. 001101 = 1. 101 · 2 . So the exponent is -3, which makes the biased exponent used by the FLOAT32 format 127 + (− 3) = 124.
The normalized binary fraction part is 10100000….
We also note that the sign is positive since 0. 203125 > 0.
To put this together to a FLOAT32 representation we append these binary numbers:
    𝑠𝑖𝑔𝑛 = 0 (𝑀𝑒𝑎𝑛𝑖𝑛𝑔 𝑡ℎ𝑎𝑡 𝑡ℎ𝑒 𝑠𝑖𝑔𝑛 𝑖𝑠 𝑝𝑜𝑠𝑖𝑡𝑖𝑣𝑒)

    𝑏𝑖𝑎𝑠𝑒𝑑 𝑒𝑥𝑝𝑜𝑛𝑒𝑛𝑡 = 12410 = 011111002 (𝑒𝑖𝑔ℎ𝑡 𝑏𝑖𝑡𝑠 𝑡𝑜 𝑟𝑒𝑝𝑟𝑒𝑠𝑒𝑛𝑡 𝑡ℎ𝑖𝑠)

    𝑓 = 101000000000000000000002 (23 𝑏𝑖𝑡𝑠 𝑡𝑜 𝑟𝑒𝑝𝑟𝑒𝑠𝑒𝑛𝑡 𝑡ℎ𝑒 𝑏𝑖𝑛𝑎𝑟𝑦 𝑓𝑟𝑎𝑐𝑡𝑖𝑜𝑛 𝑝𝑎𝑟𝑡)

    𝑟𝑒𝑠𝑢𝑙𝑡 = 0 01111100 101000000000000000000002 = 3𝐸50000016 = 1045430272 10
As a last step we then split the result up into two 16-bit high and low parts:
    ℎ𝑖𝑔ℎ = 3𝐸5016 = 1595210
    𝑙𝑜𝑤 = 000016 = 010
With the value converted to the desired format, write the two decimal numbers (15952 and 0) to the corresponding holding registers (for this example: 41302 and 41303 respectively). The Modbus function code for Write Multiple Holding Registers is 16.
Repeat this process for each setting you wish to configure for each of the sensors.
To both apply the sensor configuration and save it in non-volatile RAM so it persists across reboots (recommended), write a 2 to the holding register at address 40600 (See table 3). To only apply the sensor configuration (without saving it in non-volatile RAM), write a 1 to address 40600.
As before, even though it’s possible to save the sensor configuration in the sensor bridge itself, it is still recommended to keep up-to-date sensor configuration code in the automation controller. This is to ensure a consistent setup even if the sensor bridge needs replacing.
When the code (produced by following the instructions above) runs on the automation controller, the instructions to configure the sensors will be written to the SB1. The SB1 will then in turn talk to the sensors themselves to make them configure as specified, and therefore behave as desired.
Controlling when the sensor bridge presents new data from sensors
The SB1 supports two different behaviors for when to present new data from sensors at Modbus registers. Either you manually tell the SB1 when to reload the registers with sensor data, or you let those registers be automatically and individually updated as each new value becomes available. This is controlled by setting Sensor Reading Reload to manual or automatic. The current setting of Sensor Reading Reload is stored in the holding register at address 40602, and should either be a 1 for automatic, or a 2 for manual (see table 3). The default value is 1.
If Sensor Reading Reload is set to automatic, the registers which the SB1 presents containing data from sensors (listed in tables in later sections) will each be individually updated as soon as new data becomes available to the SB1.
If Sensor Reading Reload is set to manual, the registers which the SB1 presents containing data from sensors will all be updated at the same time and only when the SB1 is instructed to do so (by writing a 2 to the holding register at address 40602). The values stored in these registers will then not change until the SB1 receives either another instruction for a manual update, or a signal to switch Sensor Reading Reload to automatic.
Recommended automatic usage: Make sure the holding register at address 40602 contains a 1. Read the values you are interested in (as presented in later sections) as and when you need them. If you want to be sure that the readings you get are from the same point in time, you need to read input registers of a range of addresses, but you cannot read all of the registers in this fashion as there is simply too much data.
Recommended manual usage: Write a 2 to the holding register at address 40602, then read all of the sensor values you are interested in (as presented in later sections). Once you want to initiate another round of reading, write a 2 again to update all of the registers with data from sensors, and proceed to read the desired values again. Repeat this process.
While the automatic method can get you a more recent reading, it risks putting you in a situation where successive readings don’t contain sensor data that was collected concurrently as new sensor data may have appeared between the readings, thus making it difficult to use many collected data points together to reach conclusions. The manual method pauses the SB1 from introducing new sensor data to the registers until it is instructed to do so.
Accessing the sensor acceleration readings
Access the automation controller’s configuration.
Table 7: Map of registers used for the sensor acceleration readings
Address |
Description |
Type |
Size (Registers) |
|---|---|---|---|
33000-33001 |
RMS acceleration in X axis (mm/s²) |
INT32 |
2 |
33002-33003 |
Maximum recorded acc. in X axis (mm/s²) |
INT32 |
2 |
33004-33005 |
RMS acceleration in Y axis (mm/s²) |
INT32 |
2 |
33006-33007 |
Maximum recorded acc. in Y axis (mm/s²) |
INT32 |
2 |
33008-33009 |
RMS acceleration in Z axis (mm/s²) |
INT32 |
2 |
33010-33011 |
Maximum recorded acc. in Z axis (mm/s²) |
INT32 |
2 |
Address |
Description |
Type |
Size (Registers) |
|---|---|---|---|
33012-33013 |
RMS acceleration in X axis (mm/s²) |
INT32 |
2 |
33014-33015 |
Maximum recorded acc. in X axis (mm/s²) |
INT32 |
2 |
33016-33017 |
RMS acceleration in Y axis (mm/s²) |
INT32 |
2 |
33018-33019 |
Maximum recorded acc. in Y axis (mm/s²) |
INT32 |
2 |
33020-33021 |
RMS acceleration in Z axis (mm/s²) |
INT32 |
2 |
33022-33023 |
Maximum recorded acc. in Z axis (mm/s²) |
INT32 |
2 |
Address |
Description |
Type |
Size (Registers) |
|---|---|---|---|
33024-33025 |
RMS acceleration in X axis (mm/s²) |
INT32 |
2 |
33026-33027 |
Maximum recorded acc. in X axis (mm/s²) |
INT32 |
2 |
33028-33029 |
RMS acceleration in Y axis (mm/s²) |
INT32 |
2 |
33030-33031 |
Maximum recorded acc. in Y axis (mm/s²) |
INT32 |
2 |
33032-33033 |
RMS acceleration in Z axis (mm/s²) |
INT32 |
2 |
33034-33035 |
Maximum recorded acc. in Z axis (mm/s²) |
INT32 |
2 |
Address |
Description |
Type |
Size (Registers) |
|---|---|---|---|
33036-33037 |
RMS acceleration in X axis (mm/s²) |
INT32 |
2 |
33038-33039 |
Maximum recorded acc. in X axis (mm/s²) |
INT32 |
2 |
33040-33041 |
RMS acceleration in Y axis (mm/s²) |
INT32 |
2 |
33042-33043 |
Maximum recorded acc. in Y axis (mm/s²) |
INT32 |
2 |
33044-33045 |
RMS acceleration in Z axis (mm/s²) |
INT32 |
2 |
33046-33047 |
Maximum recorded acc. in Z axis (mm/s²) |
INT32 |
2 |
Address |
Description |
Type |
Size (Registers) |
|---|---|---|---|
33048-33049 |
RMS acceleration in X axis (mm/s²) |
INT32 |
2 |
33050-33051 |
Maximum recorded acc. in X axis (mm/s²) |
INT32 |
2 |
33052-33053 |
RMS acceleration in Y axis (mm/s²) |
INT32 |
2 |
33054-33055 |
Maximum recorded acc. in Y axis (mm/s²) |
INT32 |
2 |
33056-33057 |
RMS acceleration in Z axis (mm/s²) |
INT32 |
2 |
33058-33059 |
Maximum recorded acc. in Z axis (mm/s²) |
INT32 |
2 |
Address |
Description |
Type |
Size (Registers) |
|---|---|---|---|
33060-33061 |
RMS acceleration in X axis (mm/s²) |
INT32 |
2 |
33062-33063 |
Maximum recorded acc. in X axis (mm/s²) |
INT32 |
2 |
33064-33065 |
RMS acceleration in Y axis (mm/s²) |
INT32 |
2 |
33066-33067 |
Maximum recorded acc. in Y axis (mm/s²) |
INT32 |
2 |
33068-33069 |
RMS acceleration in Z axis (mm/s²) |
INT32 |
2 |
33070-33071 |
Maximum recorded acc. in Z axis (mm/s²) |
INT32 |
2 |
Address |
Description |
Type |
Size (Registers) |
|---|---|---|---|
33072-33073 |
RMS acceleration in X axis (mm/s²) |
INT32 |
2 |
33074-33075 |
Maximum recorded acc. in X axis (mm/s²) |
INT32 |
2 |
33076-33077 |
RMS acceleration in Y axis (mm/s²) |
INT32 |
2 |
33078-33079 |
Maximum recorded acc. in Y axis (mm/s²) |
INT32 |
2 |
33080-33081 |
RMS acceleration in Z axis (mm/s²) |
INT32 |
2 |
33082-33083 |
Maximum recorded acc. in Z axis (mm/s²) |
INT32 |
2 |
Address |
Description |
Type |
Size (Registers) |
|---|---|---|---|
33084-33085 |
RMS acceleration in X axis (mm/s²) |
INT32 |
2 |
33086-33087 |
Maximum recorded acc. in X axis (mm/s²) |
INT32 |
2 |
33088-33089 |
RMS acceleration in Y axis (mm/s²) |
INT32 |
2 |
33090-33091 |
Maximum recorded acc. in Y axis (mm/s²) |
INT32 |
2 |
33092-33093 |
RMS acceleration in Z axis (mm/s²) |
INT32 |
2 |
33094-33095 |
Maximum recorded acc. in Z axis (mm/s²) |
INT32 |
2 |
The readings from each sensor slot will be available at input registers according to table 7. So if we e.g. want to access the Z-axis RMS acceleration for the sensor we registered to slot 2, we would read the two input registers starting at address 33020. (The Modbus function code for Read Input Registers is 4.)
If a sensor is not working, all of its values will be 0.
To avoid having to perform a large number of read operations for individual values, we can instead perform a single read operation for a whole block of addresses within the sensor acceleration readings address space. To do this, first understand which address range you wish to read by looking at table 7. The data can then be accessed by reading input registers at the address of the beginning of the range, and providing the length of the range as the amount of registers to read. For example if we wish to get all the acceleration readings for the sensors at slots 1, 2, and 3, we would read input registers at address 33000 with a length of 36 registers. One benefit of this approach, if you have Sensor Reading Reload set to automatic, is that you get a snapshot of the state of multiple readings, instead of a slight delay between successive readings.
Once the desired data has been accessed, it can be stored in variables and then be used for, e.g., predictive maintenance or process optimization.
Accessing the aggregated sensor values
Access the automation controller’s configuration.
Table 8: Map of registers used for the aggregated sensor values (all values presented in this table are of type FLOAT32 and are two registers in size)
Address |
Description |
|---|---|
34000-34001 |
Root mean square amplitude of acceleration in X axis (m/s²) |
34002-34003 |
Root mean square amplitude of acceleration in Y axis (m/s²) |
34004-34005 |
Root mean square amplitude of acceleration in Z axis (m/s²) |
34048-34049 |
Peak amplitude of acceleration in X axis (m/s²) |
34050-34051 |
Peak amplitude of acceleration in Y axis (m/s²) |
34052-34053 |
Peak amplitude of acceleration in Z axis (m/s²) |
34096-34097 |
Root mean square amplitude of velocity in X axis (m/s) |
34098-34099 |
Root mean square amplitude of velocity in Y axis (m/s) |
34100-34101 |
Root mean square amplitude of velocity in Z axis (m/s) |
34144-34145 |
Peak amplitude of velocity in X axis (m/s) |
34146-34147 |
Peak amplitude of velocity in Y axis (m/s) |
34148-34149 |
Peak amplitude of velocity in Z axis (m/s) |
34192-34193 |
Peak-to-peak amplitude of displacement in X axis (m) |
34194-34195 |
Peak-to-peak amplitude of displacement in Y axis (m) |
34196-34197 |
Peak-to-peak amplitude of displacement in Z axis (m) |
34240-34241 |
Planar stroke calculated with method A in XY plane (m) |
34242-34243 |
Planar stroke calculated with method A in YZ plane (m) |
34244-34245 |
Planar stroke calculated with method A in XZ plane (m) |
34288-34289 |
Planar stroke calculated with method B in XY plane (m) |
34290-34291 |
Planar stroke calculated with method B in YZ plane (m) |
34292-34293 |
Planar stroke calculated with method B in XZ plane (m) |
34336-34337 |
Frequency of the highest spectral peak in X axis (Hz) |
34338-34339 |
Frequency of the highest spectral peak in Y axis (Hz) |
34340-34341 |
Frequency of the highest spectral peak in Z axis (Hz) |
34384-34385 |
Crest factor of acceleration in X axis |
34386-34387 |
Crest factor of acceleration in Y axis |
34388-34389 |
Crest factor of acceleration in Z axis |
Address |
Description |
|---|---|
34006-34007 |
Root mean square amplitude of acceleration in X axis (m/s²) |
34008-34009 |
Root mean square amplitude of acceleration in Y axis (m/s²) |
34010-34011 |
Root mean square amplitude of acceleration in Z axis (m/s²) |
34054-34055 |
Peak amplitude of acceleration in X axis (m/s²) |
34056-34057 |
Peak amplitude of acceleration in Y axis (m/s²) |
34058-34059 |
Peak amplitude of acceleration in Z axis (m/s²) |
34102-34103 |
Root mean square amplitude of velocity in X axis (m/s) |
34104-34105 |
Root mean square amplitude of velocity in Y axis (m/s) |
34106-34107 |
Root mean square amplitude of velocity in Z axis (m/s) |
34150-34151 |
Peak amplitude of velocity in X axis (m/s) |
34152-34153 |
Peak amplitude of velocity in Y axis (m/s) |
34154-34155 |
Peak amplitude of velocity in Z axis (m/s) |
34198-34199 |
Peak-to-peak amplitude of displacement in X axis (m) |
34200-34201 |
Peak-to-peak amplitude of displacement in Y axis (m) |
34202-34203 |
Peak-to-peak amplitude of displacement in Z axis (m) |
34246-34247 |
Planar stroke calculated with method A in XY plane (m) |
34248-34249 |
Planar stroke calculated with method A in YZ plane (m) |
34250-34251 |
Planar stroke calculated with method A in XZ plane (m) |
34294-34295 |
Planar stroke calculated with method B in XY plane (m) |
34296-34297 |
Planar stroke calculated with method B in YZ plane (m) |
34298-34299 |
Planar stroke calculated with method B in XZ plane (m) |
34342-34343 |
Frequency of the highest spectral peak in X axis (Hz) |
34344-34345 |
Frequency of the highest spectral peak in Y axis (Hz) |
34346-34347 |
Frequency of the highest spectral peak in Z axis (Hz) |
34390-34391 |
Crest factor of acceleration in X axis |
34392-34393 |
Crest factor of acceleration in Y axis |
34394-34395 |
Crest factor of acceleration in Z axis |
Address |
Description |
|---|---|
34012-34013 |
Root mean square amplitude of acceleration in X axis (m/s²) |
34014-34015 |
Root mean square amplitude of acceleration in Y axis (m/s²) |
34016-34017 |
Root mean square amplitude of acceleration in Z axis (m/s²) |
34060-34061 |
Peak amplitude of acceleration in X axis (m/s²) |
34062-34063 |
Peak amplitude of acceleration in Y axis (m/s²) |
34064-34065 |
Peak amplitude of acceleration in Z axis (m/s²) |
34108-34109 |
Root mean square amplitude of velocity in X axis (m/s) |
34110-34111 |
Root mean square amplitude of velocity in Y axis (m/s) |
34112-34113 |
Root mean square amplitude of velocity in Z axis (m/s) |
34156-34157 |
Peak amplitude of velocity in X axis (m/s) |
34158-34159 |
Peak amplitude of velocity in Y axis (m/s) |
34160-34161 |
Peak amplitude of velocity in Z axis (m/s) |
34204-34205 |
Peak-to-peak amplitude of displacement in X axis (m) |
34206-34207 |
Peak-to-peak amplitude of displacement in Y axis (m) |
34208-34209 |
Peak-to-peak amplitude of displacement in Z axis (m) |
34252-34253 |
Planar stroke calculated with method A in XY plane (m) |
34254-34255 |
Planar stroke calculated with method A in YZ plane (m) |
34256-34257 |
Planar stroke calculated with method A in XZ plane (m) |
34300-34301 |
Planar stroke calculated with method B in XY plane (m) |
34302-34303 |
Planar stroke calculated with method B in YZ plane (m) |
34304-34305 |
Planar stroke calculated with method B in XZ plane (m) |
34348-34349 |
Frequency of the highest spectral peak in X axis (Hz) |
34350-34351 |
Frequency of the highest spectral peak in Y axis (Hz) |
34352-34353 |
Frequency of the highest spectral peak in Z axis (Hz) |
34396-34397 |
Crest factor of acceleration in X axis |
34398-34399 |
Crest factor of acceleration in Y axis |
34400-34401 |
Crest factor of acceleration in Z axis |
Address |
Description |
|---|---|
34018-34019 |
Root mean square amplitude of acceleration in X axis (m/s²) |
34020-34021 |
Root mean square amplitude of acceleration in Y axis (m/s²) |
34022-34023 |
Root mean square amplitude of acceleration in Z axis (m/s²) |
34066-34067 |
Peak amplitude of acceleration in X axis (m/s²) |
34068-34069 |
Peak amplitude of acceleration in Y axis (m/s²) |
34070-34071 |
Peak amplitude of acceleration in Z axis (m/s²) |
34114-34115 |
Root mean square amplitude of velocity in X axis (m/s) |
34116-34117 |
Root mean square amplitude of velocity in Y axis (m/s) |
34118-34119 |
Root mean square amplitude of velocity in Z axis (m/s) |
34162-34163 |
Peak amplitude of velocity in X axis (m/s) |
34164-34165 |
Peak amplitude of velocity in Y axis (m/s) |
34166-34167 |
Peak amplitude of velocity in Z axis (m/s) |
34210-34211 |
Peak-to-peak amplitude of displacement in X axis (m) |
34212-34213 |
Peak-to-peak amplitude of displacement in Y axis (m) |
34214-34215 |
Peak-to-peak amplitude of displacement in Z axis (m) |
34258-34259 |
Planar stroke calculated with method A in XY plane (m) |
34260-34261 |
Planar stroke calculated with method A in YZ plane (m) |
34262-34263 |
Planar stroke calculated with method A in XZ plane (m) |
34306-34307 |
Planar stroke calculated with method B in XY plane (m) |
34308-34309 |
Planar stroke calculated with method B in YZ plane (m) |
34310-34311 |
Planar stroke calculated with method B in XZ plane (m) |
34354-34355 |
Frequency of the highest spectral peak in X axis (Hz) |
34356-34357 |
Frequency of the highest spectral peak in Y axis (Hz) |
34358-34359 |
Frequency of the highest spectral peak in Z axis (Hz) |
34402-34403 |
Crest factor of acceleration in X axis |
34404-34405 |
Crest factor of acceleration in Y axis |
34406-34407 |
Crest factor of acceleration in Z axis |
Address |
Description |
|---|---|
34024-34025 |
Root mean square amplitude of acceleration in X axis (m/s²) |
34026-34027 |
Root mean square amplitude of acceleration in Y axis (m/s²) |
34028-34029 |
Root mean square amplitude of acceleration in Z axis (m/s²) |
34072-34073 |
Peak amplitude of acceleration in X axis (m/s²) |
34074-34075 |
Peak amplitude of acceleration in Y axis (m/s²) |
34076-34077 |
Peak amplitude of acceleration in Z axis (m/s²) |
34120-34121 |
Root mean square amplitude of velocity in X axis (m/s) |
34122-34123 |
Root mean square amplitude of velocity in Y axis (m/s) |
34124-34125 |
Root mean square amplitude of velocity in Z axis (m/s) |
34168-34169 |
Peak amplitude of velocity in X axis (m/s) |
34170-34171 |
Peak amplitude of velocity in Y axis (m/s) |
34172-34173 |
Peak amplitude of velocity in Z axis (m/s) |
34216-34217 |
Peak-to-peak amplitude of displacement in X axis (m) |
34218-34219 |
Peak-to-peak amplitude of displacement in Y axis (m) |
34220-34221 |
Peak-to-peak amplitude of displacement in Z axis (m) |
34264-34265 |
Planar stroke calculated with method A in XY plane (m) |
34266-34267 |
Planar stroke calculated with method A in YZ plane (m) |
34268-34269 |
Planar stroke calculated with method A in XZ plane (m) |
34312-34313 |
Planar stroke calculated with method B in XY plane (m) |
34314-34315 |
Planar stroke calculated with method B in YZ plane (m) |
34316-34317 |
Planar stroke calculated with method B in XZ plane (m) |
34360-34361 |
Frequency of the highest spectral peak in X axis (Hz) |
34362-34363 |
Frequency of the highest spectral peak in Y axis (Hz) |
34364-34365 |
Frequency of the highest spectral peak in Z axis (Hz) |
34408-34409 |
Crest factor of acceleration in X axis |
34410-34411 |
Crest factor of acceleration in Y axis |
34412-34413 |
Crest factor of acceleration in Z axis |
Address |
Description |
|---|---|
34030-34031 |
Root mean square amplitude of acceleration in X axis (m/s²) |
34032-34033 |
Root mean square amplitude of acceleration in Y axis (m/s²) |
34034-34035 |
Root mean square amplitude of acceleration in Z axis (m/s²) |
34078-34079 |
Peak amplitude of acceleration in X axis (m/s²) |
34080-34081 |
Peak amplitude of acceleration in Y axis (m/s²) |
34082-34083 |
Peak amplitude of acceleration in Z axis (m/s²) |
34126-34127 |
Root mean square amplitude of velocity in X axis (m/s) |
34128-34129 |
Root mean square amplitude of velocity in Y axis (m/s) |
34130-34131 |
Root mean square amplitude of velocity in Z axis (m/s) |
34174-34175 |
Peak amplitude of velocity in X axis (m/s) |
34176-34177 |
Peak amplitude of velocity in Y axis (m/s) |
34178-34179 |
Peak amplitude of velocity in Z axis (m/s) |
34222-34223 |
Peak-to-peak amplitude of displacement in X axis (m) |
34224-34225 |
Peak-to-peak amplitude of displacement in Y axis (m) |
34226-34227 |
Peak-to-peak amplitude of displacement in Z axis (m) |
34270-34271 |
Planar stroke calculated with method A in XY plane (m) |
34272-34273 |
Planar stroke calculated with method A in YZ plane (m) |
34274-34275 |
Planar stroke calculated with method A in XZ plane (m) |
34318-34319 |
Planar stroke calculated with method B in XY plane (m) |
34320-34321 |
Planar stroke calculated with method B in YZ plane (m) |
34322-34323 |
Planar stroke calculated with method B in XZ plane (m) |
34366-34367 |
Frequency of the highest spectral peak in X axis (Hz) |
34368-34369 |
Frequency of the highest spectral peak in Y axis (Hz) |
34370-34371 |
Frequency of the highest spectral peak in Z axis (Hz) |
34414-34415 |
Crest factor of acceleration in X axis |
34416-34417 |
Crest factor of acceleration in Y axis |
34418-34419 |
Crest factor of acceleration in Z axis |
Address |
Description |
|---|---|
34036-34037 |
Root mean square amplitude of acceleration in X axis (m/s²) |
34038-34039 |
Root mean square amplitude of acceleration in Y axis (m/s²) |
34040-34041 |
Root mean square amplitude of acceleration in Z axis (m/s²) |
34084-34085 |
Peak amplitude of acceleration in X axis (m/s²) |
34086-34087 |
Peak amplitude of acceleration in Y axis (m/s²) |
34088-34089 |
Peak amplitude of acceleration in Z axis (m/s²) |
34132-34133 |
Root mean square amplitude of velocity in X axis (m/s) |
34134-34135 |
Root mean square amplitude of velocity in Y axis (m/s) |
34136-34137 |
Root mean square amplitude of velocity in Z axis (m/s) |
34180-34181 |
Peak amplitude of velocity in X axis (m/s) |
34182-34183 |
Peak amplitude of velocity in Y axis (m/s) |
34184-34185 |
Peak amplitude of velocity in Z axis (m/s) |
34228-34229 |
Peak-to-peak amplitude of displacement in X axis (m) |
34230-34231 |
Peak-to-peak amplitude of displacement in Y axis (m) |
34232-34233 |
Peak-to-peak amplitude of displacement in Z axis (m) |
34276-34277 |
Planar stroke calculated with method A in XY plane (m) |
34278-34279 |
Planar stroke calculated with method A in YZ plane (m) |
34280-34281 |
Planar stroke calculated with method A in XZ plane (m) |
34324-34325 |
Planar stroke calculated with method B in XY plane (m) |
34326-34327 |
Planar stroke calculated with method B in YZ plane (m) |
34328-34329 |
Planar stroke calculated with method B in XZ plane (m) |
34372-34373 |
Frequency of the highest spectral peak in X axis (Hz) |
34374-34375 |
Frequency of the highest spectral peak in Y axis (Hz) |
34376-34377 |
Frequency of the highest spectral peak in Z axis (Hz) |
34420-34421 |
Crest factor of acceleration in X axis |
34422-34423 |
Crest factor of acceleration in Y axis |
34424-34425 |
Crest factor of acceleration in Z axis |
Address |
Description |
|---|---|
34042-34043 |
Root mean square amplitude of acceleration in X axis (m/s²) |
34044-34045 |
Root mean square amplitude of acceleration in Y axis (m/s²) |
34046-34047 |
Root mean square amplitude of acceleration in Z axis (m/s²) |
34090-34091 |
Peak amplitude of acceleration in X axis (m/s²) |
34092-34093 |
Peak amplitude of acceleration in Y axis (m/s²) |
34094-34095 |
Peak amplitude of acceleration in Z axis (m/s²) |
34138-34139 |
Root mean square amplitude of velocity in X axis (m/s) |
34140-34141 |
Root mean square amplitude of velocity in Y axis (m/s) |
34142-34143 |
Root mean square amplitude of velocity in Z axis (m/s) |
34186-34187 |
Peak amplitude of velocity in X axis (m/s) |
34188-34189 |
Peak amplitude of velocity in Y axis (m/s) |
34190-34191 |
Peak amplitude of velocity in Z axis (m/s) |
34234-34235 |
Peak-to-peak amplitude of displacement in X axis (m) |
34236-34237 |
Peak-to-peak amplitude of displacement in Y axis (m) |
34238-34239 |
Peak-to-peak amplitude of displacement in Z axis (m) |
34282-34283 |
Planar stroke calculated with method A in XY plane (m) |
34284-34285 |
Planar stroke calculated with method A in YZ plane (m) |
34286-34287 |
Planar stroke calculated with method A in XZ plane (m) |
34330-34331 |
Planar stroke calculated with method B in XY plane (m) |
34332-34333 |
Planar stroke calculated with method B in YZ plane (m) |
34334-34335 |
Planar stroke calculated with method B in XZ plane (m) |
34378-34379 |
Frequency of the highest spectral peak in X axis (Hz) |
34380-34381 |
Frequency of the highest spectral peak in Y axis (Hz) |
34382-34383 |
Frequency of the highest spectral peak in Z axis (Hz) |
34426-34427 |
Crest factor of acceleration in X axis |
34428-34429 |
Crest factor of acceleration in Y axis |
34430-34431 |
Crest factor of acceleration in Z axis |
Look in table 8 to see which input registers contain each specific reading for each sensor slot. If we e.g. want to access the Peak amplitude of velocity in Y axis (m/s) for the sensor we registered to slot 2, we would read the two input registers starting at address 34152. (The Modbus function code for Read Input Registers is 4.)
If a sensor is not working, all of its values will be 0.
To avoid having to perform a large number of read operations for individual values, we can instead perform a single read operation for a whole block of addresses within the aggregated sensor values address space. To do this, first understand which address range you wish to read by looking at table 8. The data can then be accessed by reading input registers at the address of the beginning of the range, and providing the length of the range as the amount of registers to read. For example if we wish to get the Crest factor of acceleration in X, Y, and Z axis for the sensors at slots 3, 4, and 5, we would read input registers at address 34396 with a length of 18 registers. One benefit of this approach, if you have Sensor Reading Reload set to automatic, is that you get a snapshot of the state of multiple readings, instead of a slight delay between successive readings.
Once the desired data has been accessed, it can be stored in variables and then be used for, e.g., predictive maintenance or process optimization.
Accessing the sensor health data
Access the automation controller’s configuration.
Table 9: Map of registers used for the sensor health data. This block repeats for the eight sensors at addresses 31100, 31200, …, 31800.
Address |
Description |
Type |
Size (Registers) |
|---|---|---|---|
31100-31101 |
Sensor uptime (seconds) |
UINT32 |
2 |
31102 |
Reboot count |
UINT16 |
1 |
31103 |
Reset cause |
UINT16 |
1 |
31104 |
Temperature (x100 °C) |
INT16 |
1 |
31105 |
Battery voltage (mV) |
UINT16 |
1 |
31106 |
RSSI (dBm x100) |
INT16 |
1 |
31107 |
Energy harvesting voltage (mV) |
UINT16 |
1 |
31108-31109 |
Clock sync skew |
FLOAT32 |
2 |
31110-31111 |
Clock sync age (ms) |
INT32 |
2 |
31112-31113 |
Clock sync diff |
INT32 |
2 |
31114 |
Health data age (seconds) |
UINT16 |
1 |
Address |
Description |
Type |
Size (Registers) |
|---|---|---|---|
31200-31201 |
Sensor uptime (seconds) |
UINT32 |
2 |
31202 |
Reboot count |
UINT16 |
1 |
31203 |
Reset cause |
UINT16 |
1 |
31204 |
Temperature (x100 °C) |
INT16 |
1 |
31205 |
Battery voltage (mV) |
UINT16 |
1 |
31206 |
RSSI (dBm x100) |
INT16 |
1 |
31207 |
Energy harvesting voltage (mV) |
UINT16 |
1 |
31208-31209 |
Clock sync skew |
FLOAT32 |
2 |
31210-31211 |
Clock sync age (ms) |
INT32 |
2 |
31212-31213 |
Clock sync diff |
INT32 |
2 |
31214 |
Health data age (seconds) |
UINT16 |
1 |
Address |
Description |
Type |
Size (Registers) |
|---|---|---|---|
31300-31301 |
Sensor uptime (seconds) |
UINT32 |
2 |
31302 |
Reboot count |
UINT16 |
1 |
31303 |
Reset cause |
UINT16 |
1 |
31304 |
Temperature (x100 °C) |
INT16 |
1 |
31305 |
Battery voltage (mV) |
UINT16 |
1 |
31306 |
RSSI (dBm x100) |
INT16 |
1 |
31307 |
Energy harvesting voltage (mV) |
UINT16 |
1 |
31308-31309 |
Clock sync skew |
FLOAT32 |
2 |
31310-31311 |
Clock sync age (ms) |
INT32 |
2 |
31312-31313 |
Clock sync diff |
INT32 |
2 |
31314 |
Health data age (seconds) |
UINT16 |
1 |
Address |
Description |
Type |
Size (Registers) |
|---|---|---|---|
31400-31401 |
Sensor uptime (seconds) |
UINT32 |
2 |
31402 |
Reboot count |
UINT16 |
1 |
31403 |
Reset cause |
UINT16 |
1 |
31404 |
Temperature (x100 °C) |
INT16 |
1 |
31405 |
Battery voltage (mV) |
UINT16 |
1 |
31406 |
RSSI (dBm x100) |
INT16 |
1 |
31407 |
Energy harvesting voltage (mV) |
UINT16 |
1 |
31408-31409 |
Clock sync skew |
FLOAT32 |
2 |
31410-31411 |
Clock sync age (ms) |
INT32 |
2 |
31412-31413 |
Clock sync diff |
INT32 |
2 |
31414 |
Health data age (seconds) |
UINT16 |
1 |
Address |
Description |
Type |
Size (Registers) |
|---|---|---|---|
31500-31501 |
Sensor uptime (seconds) |
UINT32 |
2 |
31502 |
Reboot count |
UINT16 |
1 |
31503 |
Reset cause |
UINT16 |
1 |
31504 |
Temperature (x100 °C) |
INT16 |
1 |
31505 |
Battery voltage (mV) |
UINT16 |
1 |
31506 |
RSSI (dBm x100) |
INT16 |
1 |
31507 |
Energy harvesting voltage (mV) |
UINT16 |
1 |
31508-31509 |
Clock sync skew |
FLOAT32 |
2 |
31510-31511 |
Clock sync age (ms) |
INT32 |
2 |
31512-31513 |
Clock sync diff |
INT32 |
2 |
31514 |
Health data age (seconds) |
UINT16 |
1 |
Address |
Description |
Type |
Size (Registers) |
|---|---|---|---|
31600-31601 |
Sensor uptime (seconds) |
UINT32 |
2 |
31602 |
Reboot count |
UINT16 |
1 |
31603 |
Reset cause |
UINT16 |
1 |
31604 |
Temperature (x100 °C) |
INT16 |
1 |
31605 |
Battery voltage (mV) |
UINT16 |
1 |
31606 |
RSSI (dBm x100) |
INT16 |
1 |
31607 |
Energy harvesting voltage (mV) |
UINT16 |
1 |
31608-31609 |
Clock sync skew |
FLOAT32 |
2 |
31610-31611 |
Clock sync age (ms) |
INT32 |
2 |
31612-31613 |
Clock sync diff |
INT32 |
2 |
31614 |
Health data age (seconds) |
UINT16 |
1 |
Address |
Description |
Type |
Size (Registers) |
|---|---|---|---|
31700-31701 |
Sensor uptime (seconds) |
UINT32 |
2 |
31702 |
Reboot count |
UINT16 |
1 |
31703 |
Reset cause |
UINT16 |
1 |
31704 |
Temperature (x100 °C) |
INT16 |
1 |
31705 |
Battery voltage (mV) |
UINT16 |
1 |
31706 |
RSSI (dBm x100) |
INT16 |
1 |
31707 |
Energy harvesting voltage (mV) |
UINT16 |
1 |
31708-31709 |
Clock sync skew |
FLOAT32 |
2 |
31710-31711 |
Clock sync age (ms) |
INT32 |
2 |
31712-31713 |
Clock sync diff |
INT32 |
2 |
31714 |
Health data age (seconds) |
UINT16 |
1 |
Address |
Description |
Type |
Size (Registers) |
|---|---|---|---|
31800-31801 |
Sensor uptime (seconds) |
UINT32 |
2 |
31802 |
Reboot count |
UINT16 |
1 |
31803 |
Reset cause |
UINT16 |
1 |
31804 |
Temperature (x100 °C) |
INT16 |
1 |
31805 |
Battery voltage (mV) |
UINT16 |
1 |
31806 |
RSSI (dBm x100) |
INT16 |
1 |
31807 |
Energy harvesting voltage (mV) |
UINT16 |
1 |
31808-31809 |
Clock sync skew |
FLOAT32 |
2 |
31810-31811 |
Clock sync age (ms) |
INT32 |
2 |
31812-31813 |
Clock sync diff |
INT32 |
2 |
31814 |
Health data age (seconds) |
UINT16 |
1 |
The health data for each sensor will be available at input registers according to table 9. So if we e.g. want to access the Battery voltage of the sensor we registered to slot 4, we would read the input register at address 31405.
If a sensor is not working all of its values will be 0, except for the Health data age value which will be 0xFFFF.
As before, we can perform a single read operation for a block of addresses within the sensor health data address space (see table 9). However, note that in this case the block read in each single read operation needs to be contained to only one sensor’s health data, as there are unused registers between the health data for different sensors. I.e. all of the health data for one sensor can be read together, but health data for multiple sensors cannot be read together.
Once the desired health data has been accessed, it can be stored in variables and then be used for e.g. monitoring the sensors’ operational conditions.
Testing the installation
Observe the Sensor status LEDs on the side of the SB1 unit, they should be green for the sensor slots that are in use and blink when data is transmitted from each sensor.
Connect your computer to the Ethernet switch and use a Modbus client to read the sensors’ acceleration readings. Check that they are live and non-zero.
Monitor the automation controller’s operation and variables to see that it is behaving as expected.
TROUBLESHOOTING
For issues related to your automation controller, check with the relevant vendor.
Sensor bridge
● Make sure the sensor bridge is plugged into a powered PoE port on the Ethernet switch, otherwise it will not receive power.
● If you have trouble reaching the sensor bridge or have set an incorrect configuration for it, you can retrieve the IP address by pinging the sensor bridge by its hostname. If the sensor bridge’s ID (found on the casing) is AA:BB:CC:DD:EE:FF, its hostname isanura-aabbccddeeff.local (in lowercase, without the colons from the ID).
● Double check with the register map tables that you are reading and writing the correct registers for each operation.
Network
● If you can’t reach other devices through the Ethernet switch, check to see that the switch’s configuration is as you expect.
● Make sure you don’t set the same IP address for multiple devices on the network.
● Make sure all of the relevant devices have IP addresses and subnet masks configured so that they are on the same network.
Sensors
● Make sure the sensors are within range for the sensor bridge to reach them. Check the Sensor status LEDs on the side of the SB1 unit, and that the LEDs for the used sensor slots are green.
● Make sure you haven’t gotten two sensors mixed up: Check which physical sensor has which BLE address, and which BLE address has been registered to which slot.
● If a sensor is behaving in an unexpected way, you can see if the health data for that sensor indicates any issues.
Firmware updates
The SB1 supports upgrades using the Ethernet connection, firmware updates can be performed through the setup page reached by entering the sensor bridge’s IP address into a web browser address field.
Product care
To ensure the longevity and optimal performance of SB1, please follow these care instructions:
General use:
Do not drop, throw, or subject the product to excessive force, as this could damage the plastic casing, aluminum plate, or internal components.
Cleaning:
Use a soft, damp cloth to gently clean the plastic casing and aluminum bottom plate. Avoid abrasive materials or harsh cleaning agents, as they may scratch the surfaces or damage the finish.
Support, Warranty & RMA assistance
For help with product support, warranty claims, or initiating an RMA (Return Merchandise Authorization), our website provides all the resources needed.
Recycling
Disposal of Electrical and Electronic Equipment This product is marked with the crossed-out wheelie bin symbol to indicate that it must not be disposed of as general household waste. Instead, it should be taken to an appropriate collection point for recycling electrical and electronic equipment. Proper disposal helps prevent potential harm to the environment and human health and promotes the sustainable reuse of materials. For more detailed information on disposal and recycling, please contact your local authorities or the retailer where the product was purchased.
Specifications
Dimensions |
140 × 98 × 60 mm |
Weight |
560 g |
Networking Interface |
10/100 Ethernet port |
Power Input |
Power over Ethernet (48V), 802.3af |
Maximum Power Consumption |
1.2 W |
Antenna Gain |
6 dBi |
TX Power |
0 dBm |
Maximum Number of Sensors |
8 |
Certifications |
CE, FCC, IC |
Mounting |
AMPS 4-hole pattern (30 × 38 mm) |
Operating Temperature |
-40 °C to +80 °C |
Operating Humidity |
5% to 95% non-condensing |
Ingress Protection |
IP65 |